As the United States approaches a pivotal midterm election, the American electorate is finding its political priorities increasingly defined by the kitchen-table reality of rising costs. According to recent data from the Pew Research Center, the U.S. economy has cemented itself as the primary concern for voters across the political spectrum. At the heart of this economic anxiety lies the volatility of energy markets. Nearly three-quarters of Americans (74%) report being "very concerned" about the price of gasoline and energy—a sharp escalation from the 60% recorded in July and a significant leap from the 43% level seen as recently as January 2026.
A Chronology of Conflict and Cost
The surge in energy prices throughout 2026 is inextricably linked to the geopolitical instability brought on by the U.S.-Iran military conflict. The trajectory of these costs provides a sobering look at how global events translate into local financial strain.
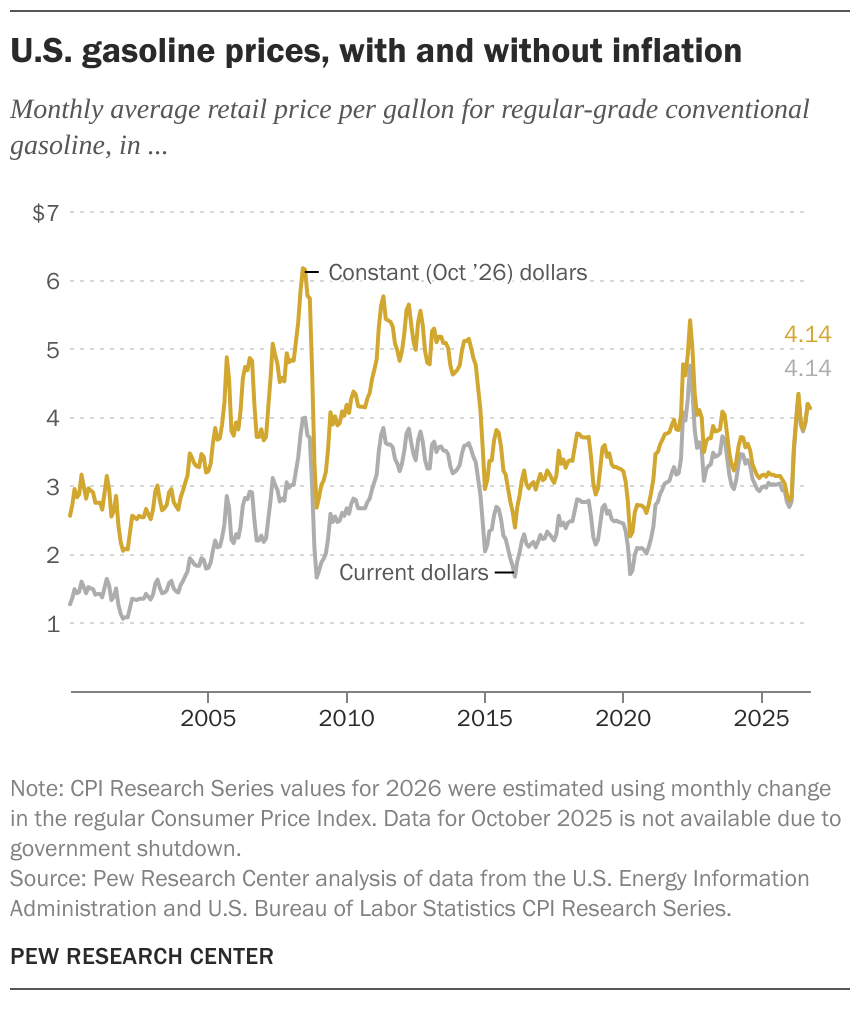
In late February 2026, just before the first wave of regional military engagements, the national average price for a gallon of regular unleaded gasoline stood at approximately $2.80, according to the U.S. Energy Information Administration (EIA). As the conflict escalated, the markets reacted with characteristic volatility. By mid-May, the price had climbed to a peak of $4.35 per gallon. While there was some stabilization in the summer months, the cost remained stubbornly high, resting at $4.12 per gallon as of October 26, 2026—a 47.4% increase from the February baseline.
The impact on commercial transit has been even more severe. Highway diesel fuel, the lifeblood of the nation’s supply chain, saw an even sharper increase. Rising from $3.81 a gallon in February, diesel prices hit $6.35 by late October, representing a staggering 66.8% jump. This price inflation creates a "multiplier effect," as the increased cost of shipping goods is inevitably passed down to consumers in the form of higher prices for groceries, household goods, and services.
Historical Context: Looking Beyond the Current Spike
While the current figures are alarming, economists often advise a long-term perspective. When adjusted for inflation, today’s prices, while elevated, sit below the historic peaks of the past.

According to Pew Research Center analysis spanning back to 1990, June 2008 remains the most expensive month to fuel a vehicle in inflation-adjusted terms. In June 2008, the national average price for regular unleaded gas was equivalent to $6.18 in today’s dollars, while diesel reached a staggering $7.26 per gallon. That historic peak was followed by a rapid collapse in prices as the global financial crisis triggered a severe recession, demonstrating that while high energy prices are painful, they are often a reflection of larger, broader economic shifts.
Measuring the Burden: Hours of Work as a Yardstick
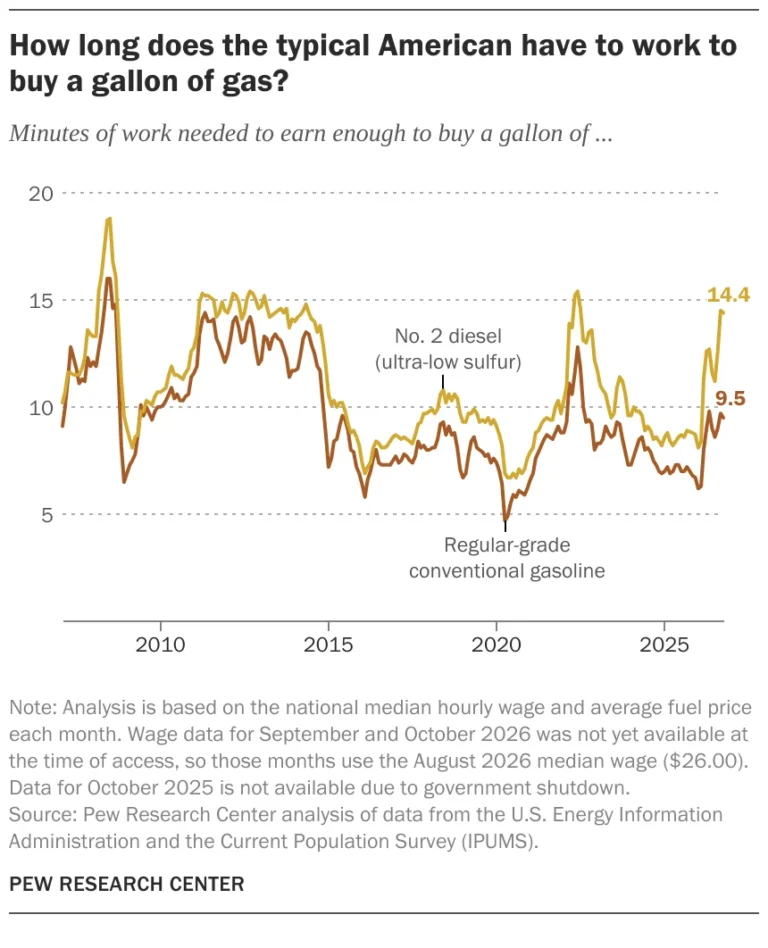
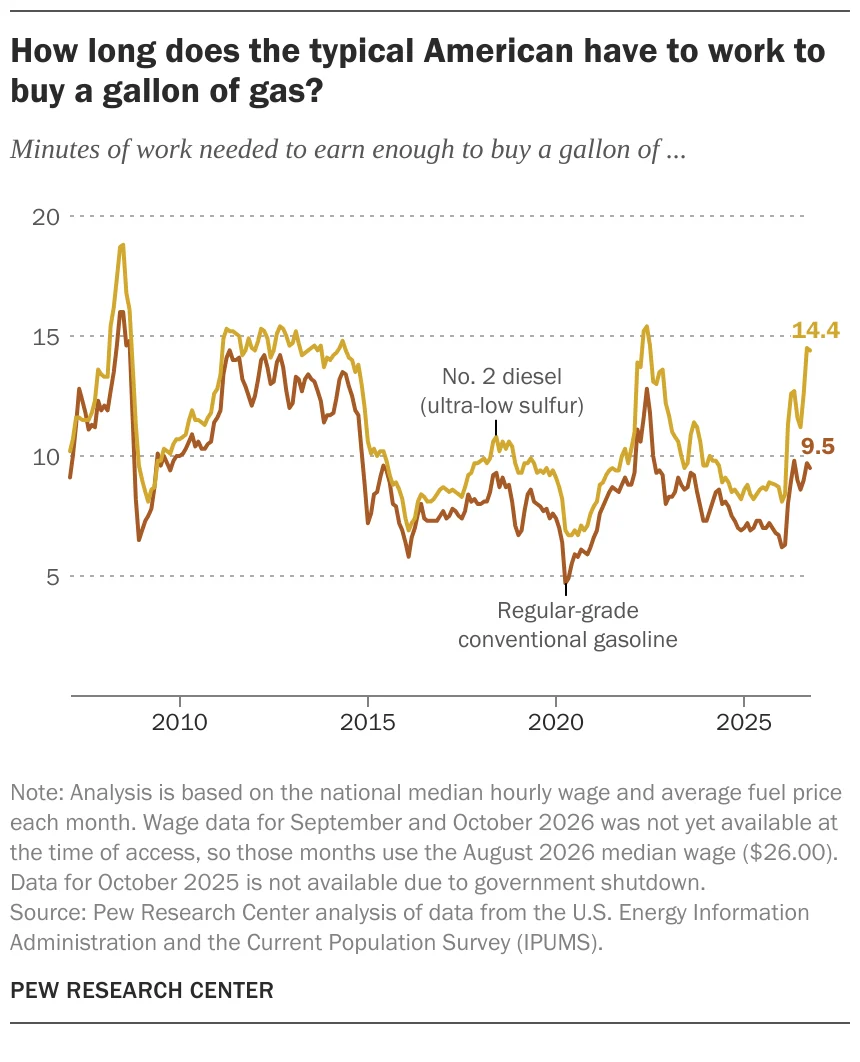
A more precise way to gauge the impact of fuel prices on the average household is to measure them against the "cost of labor"—specifically, how many minutes a typical American must work to earn enough to purchase a single gallon of gas.
In October 2026, with a national median wage of $26 per hour and an average pump price of $4.14, a worker had to spend approximately 9.5 minutes of labor to afford a gallon of gas. This is a significant increase from February 2026, when the same gallon cost only 6.3 minutes of work. For diesel, the burden is even heavier: it currently requires 14.4 minutes of work to purchase a gallon, creeping toward the record high of 18.8 minutes established in July 2008.
These figures illustrate a stark reality: when fuel prices rise faster than wages, the "real cost" of commuting and living increases, placing a disproportionate burden on low- and middle-income workers who cannot easily opt out of vehicle dependency.
Regional Disparities and Market Complexities
Fuel costs in the United States are rarely uniform, and the current landscape highlights significant regional differences. Petroleum production and refining are heavily concentrated along the Gulf Coast, which typically results in the lowest prices in the nation. In late October 2026, the Gulf Coast region reported an average price of $3.70 per gallon for regular-grade gasoline.
At the other end of the spectrum is California, where prices frequently hover well above the national average. In October 2026, the average price in the state reached $5.89 per gallon. This disparity is driven by a combination of factors, including strict environmental regulations, the use of specialized "reformulated" gasoline (RFG) required by state law to reduce smog, and unique distribution challenges.
Furthermore, the price gap between regular, midgrade, and premium fuels has expanded. In 1994, the spread between regular and premium was roughly 20 cents. By October 2026, that difference had widened to 91.7 cents. This suggests that the cost of refining and transporting higher-octane fuel has faced greater inflationary pressure than standard gasoline, further complicating the household budget for those driving vehicles that require premium fuel.
The Role of Reformulated Gas
A key, yet often overlooked, driver of price variation is the move toward "reformulated" gasoline. Designed to burn cleaner and reduce the emission of volatile organic compounds and hazardous air pollutants, RFG is mandated in many urban areas, including much of the Northeastern seaboard and California.
The economic cost of this environmental policy has become more apparent over time. In 1996, the cost difference between conventional and reformulated gas was a modest 3 cents per gallon. By October 2026, that spread had grown to 62.6 cents. While the health and environmental benefits of these standards are clear, the economic reality is that consumers in these regions are paying a significant "green premium" at the pump.
Implications for the 2026 Midterms
The political implications of these figures cannot be overstated. With the midterm elections looming, the economy is the dominant narrative. For incumbent politicians, the challenge is to explain a global energy market that is largely beyond their immediate control, while for the opposition, the high cost of living provides a powerful platform for critique.

"The price at the pump is a visible, daily tax on the consumer," notes one political analyst. "When people feel the pinch every time they drive to work or the grocery store, it becomes a proxy for how they feel about the broader state of the country. It is, by definition, the most salient issue for any candidate seeking office."
As voters head to the polls, they are weighing the immediate pain of current prices against competing policy visions. The debate is no longer just about the price per gallon; it is about the broader strategy of the American energy sector—balancing the need for affordable fuel, the necessity of long-term climate goals, and the volatile realities of global military conflicts.
Conclusion: The Road Ahead
The volatility of 2026 serves as a reminder of the fragility of the global energy supply chain. While historical data offers some comfort by showing that current price levels are not unprecedented, the immediate economic reality for American families is one of increased pressure and decreased purchasing power.
Understanding the complexity of these costs—from regional refining differences to the labor-time required to purchase fuel—is essential for both the public and policymakers. As the nation moves past the midterm elections, the focus will likely shift from the politics of the pump to the structural challenges of stabilizing energy markets in an increasingly interconnected and unstable world. Whether the economy cools or continues to burn through the budgets of American households, the lessons learned in 2026 will undoubtedly shape energy policy and electoral strategies for years to come.
Technical Note on Methodology
This analysis utilized data from the U.S. Energy Information Administration (EIA) for gasoline and diesel pricing. To provide a fair historical comparison, researchers converted all past prices into constant 2026 dollars using the Consumer Price Index Retroactive Series (CPI-U-RS) from the Bureau of Labor Statistics. For labor-time calculations, the study relied on median hourly earnings data from the Current Population Survey via IPUMS. Note: Due to the government shutdown in 2025, data for October of that year is excluded, and August 2026 wage figures were used as a proxy for the subsequent months of 2026.
About the Author