In the high-stakes world of corporate leadership, the adage that "not all paychecks are created equal" has never been more accurate. While the size of an organization remains the primary anchor for determining executive compensation, new data from the 2026–2027 survey of 1,551 U.S. companies reveals that the industry in which a company operates acts as a powerful multiplier—or anchor—for a CEO’s take-home pay.
As boards of directors and compensation committees look toward the 2027 fiscal year, they are grappling with a complex web of economic variables. From the volatile bonuses in pharmaceutical boardrooms to the mission-driven constraints of the non-profit sector, understanding the "why" behind the numbers is now a prerequisite for effective governance.
The Hierarchy of Compensation: Who Leads the Pack?
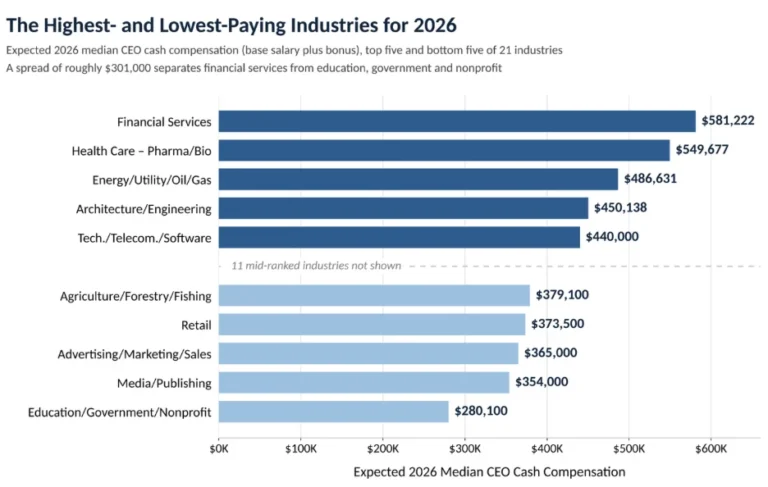
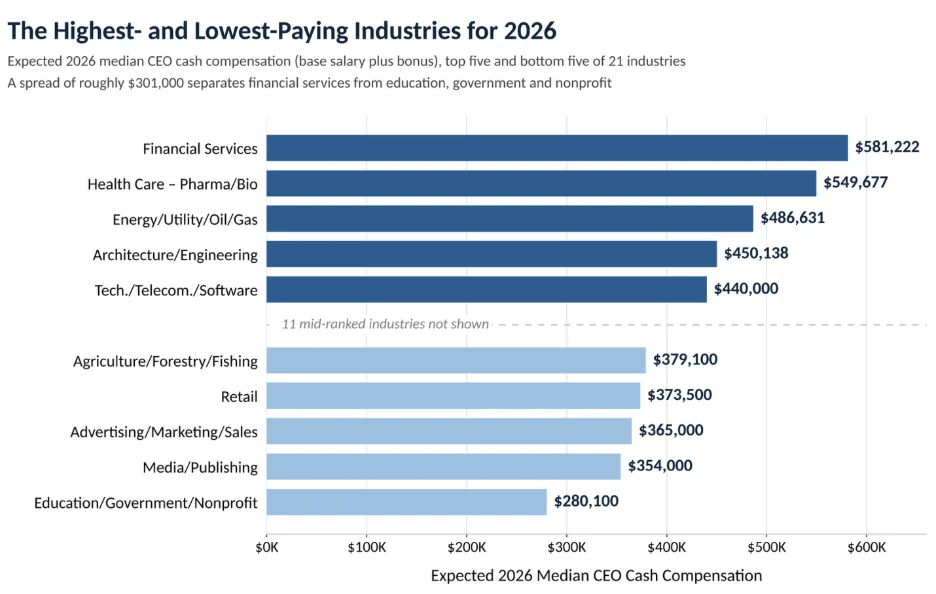
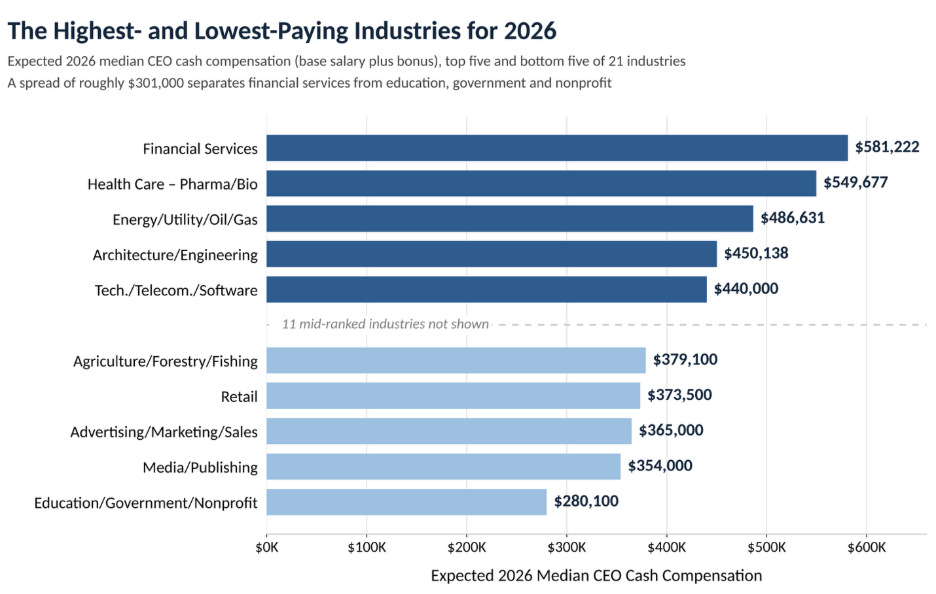
The latest survey data paints a vivid picture of the disparities across the American business landscape. Financial services lead the charge, with CEOs in this sector projected to command a median cash compensation of $581,222 for 2026. This figure comprises a robust base salary of $418,722 bolstered by a $162,500 bonus.
Trailing slightly behind are the leaders of the pharmaceutical and biotechnology sectors, with a median package of $549,677. Energy, utilities, and the oil and gas sector round out the top three at $486,631. The disparity between these leaders and the bottom tier is stark; CEOs in education, government, and nonprofit organizations are projected to earn a median of just $280,100—a nearly $300,000 gap that highlights the vastly different economic realities of private-sector commerce versus public-service mandates.
The Top and Bottom Five (2026 Projections)
The Highest-Earning Sectors:
- Financial Services: $581,222
- Pharmaceuticals & Biotech: $549,677
- Energy, Utilities, Oil & Gas: $486,631
- Architecture & Engineering: $450,138
- Technology, Telecommunications & Software: $440,000
The Lowest-Earning Sectors:
- Education, Government, Nonprofits: $280,100
- Media & Publishing: $354,000
- Advertising, Marketing & Sales: $365,000
- Retail: $373,500
- Agriculture, Forestry & Fishing: $379,100
The Dangers of Siloed Data: Why Size Matters More Than Industry
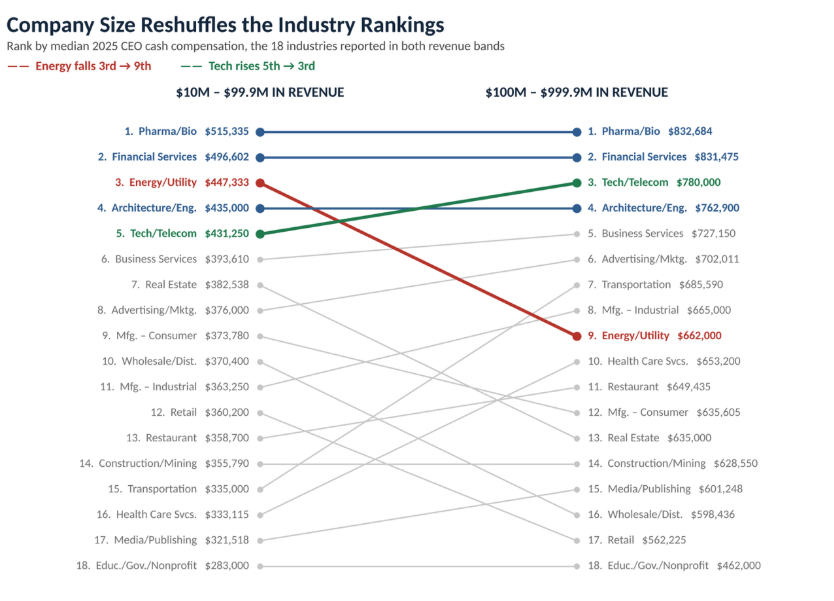
While these industry averages provide a useful starting point, relying on them in isolation is a tactical error for compensation committees. The data indicates that industry rankings can be misleading because they are heavily influenced by the average size of companies within that sector. A sector with a high density of massive, multi-billion-dollar firms will naturally show higher executive pay, even if CEOs at smaller, similar-sized firms in other sectors are performing equivalent work.
When we isolate companies by revenue, the picture shifts dramatically. For firms generating $10 million to $99.9 million, pharma and biotech CEOs lead at $515,335, with financial services closely behind at $496,602. However, when we scale up to companies in the $100 million to $999.9 million range, the technology sector surges into the third position ($780,000), while the energy sector—which ranks third overall—drops significantly.
This suggests that for boards, the most accurate benchmarking strategy is to pair industry data with revenue-based metrics. A CEO’s pay is a reflection of the specific "weight class" of the company they manage, not just the sector in which they compete.
Chronology: A Three-Year Trajectory of Volatility
A retrospective analysis of the past three years reveals how global economic shifts have directly impacted the CEO’s wallet.
- 2024: The market was in a state of relative stability. Financial services CEOs led with a median of $597,500.
- 2025: A widespread cooling effect took hold. Financial services saw a decline to $540,265, while the pharma/biotech sector dropped from $532,312 down to $476,517.
- 2026: A clear rebound is underway. The recovery is driven primarily by a resurgence in variable pay—bonuses. In the pharma/biotech space, for example, the median bonus jumped from $90,000 in 2025 to $150,000 in 2026, while base salaries remained relatively flat.
This pattern demonstrates a crucial takeaway: when times get tough, base salaries remain the "sticky" component of compensation, while bonuses act as the primary valve for economic volatility.
Sector-Specific Drivers: The "Why" Behind the Pay
Why does the financial sector consistently pay more than the retail sector? The answer lies in the nature of the value being generated.
Financial Services and Biotech: The High-Risk, High-Reward Model
Financial services demand constant capital management and complex risk assessment. The high compensation reflects the direct link between executive decision-making and company profit. Similarly, the pharma/biotech sector faces unique "scientific uncertainty." With massive research investments and the "binary" outcome of regulatory approval (or failure), the premium on leadership capable of navigating these long, high-risk development timelines is immense.
Retail: The Squeeze on Incentives
Retail stands out as a "loser" in recent years, with projected compensation falling from $411,695 in 2024 to $373,500 in 2026. This decline is largely attributed to a contraction in bonuses—down from $117,632 to $75,000. Retail is a sector defined by thin operating margins and intense labor cost pressures. As consumer demand fluctuates and inflation impacts overhead, retail boards have clearly moved to protect base margins by tightening the variable pay allocated to the C-suite.
Implications for 2027 and Beyond
As companies look toward the 2027 fiscal year, the data offers three clear imperatives for boards and executive leadership:
- Stop Using "Average" as a Benchmark: Because industry-wide averages are skewed by firm size, companies must utilize granular data that accounts for revenue bands. A $50 million software company should not be benchmarking itself against a $500 million software conglomerate.
- Variable Pay as a Strategic Tool: The recent data shows that bonuses are the primary vehicle for market adjustments. Boards should consider whether their bonus structures are currently aligned with the specific performance goals that will drive growth in 2027, rather than defaulting to standard industry bonus percentages.
- Contextualize Stability vs. Volatility: Industries like energy have shown remarkable stability in pay, while biotech is highly reactive to market cycles. Boards in volatile sectors must communicate the rationale for "down years" clearly to shareholders to prevent executive churn, while boards in stable sectors must ensure their compensation packages remain competitive enough to attract top-tier talent during growth phases.
Ultimately, the 2026–2027 data serves as a diagnostic tool. While the headline numbers offer a snapshot of the current market, the real value lies in the movement beneath the surface. As the economy continues to evolve, the most successful companies will be those that view compensation not as a fixed cost, but as a dynamic reflection of their specific industry’s risks, rewards, and strategic necessities. For those charged with setting the pay of the nation’s leaders, the lesson is clear: Industry provides the context, but the company’s own size and performance must dictate the final figure.
About the Author