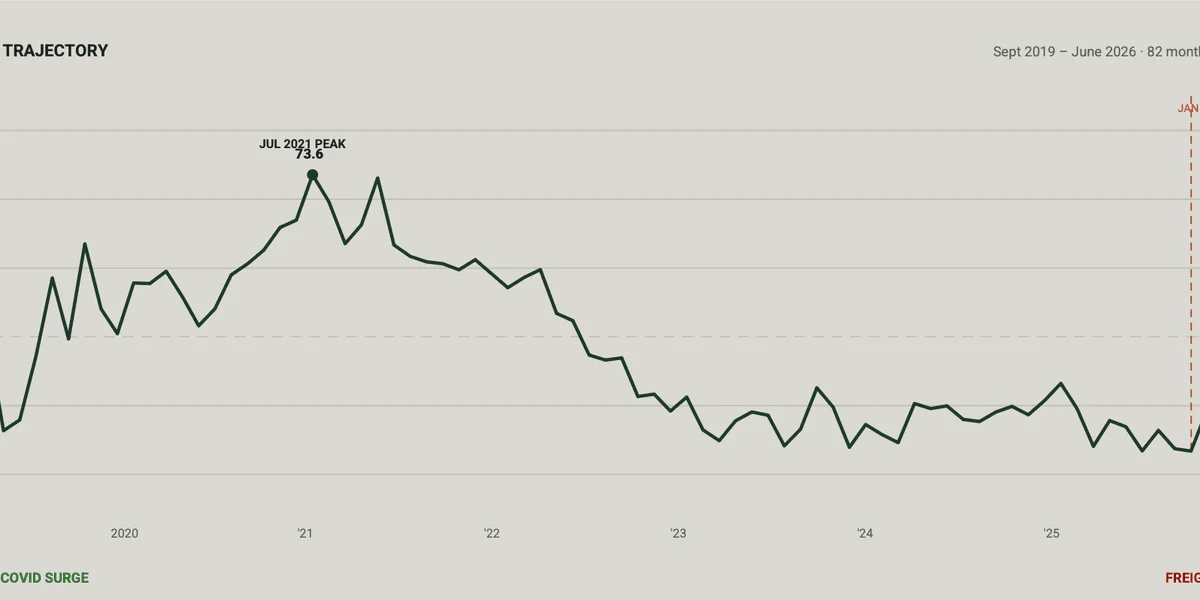
The U.S. logistics and warehousing sector continues to navigate a turbulent period of uncertainty, as the latest data from the Warehouse on Wheels (WOW) Supply Chain Activity Index confirms that domestic supply chain operations remain firmly in a state of contraction. For stakeholders ranging from fleet operators to warehouse developers, the message is clear: the market has yet to find its footing, lingering well below the long-run neutral average.
As the industry approaches the latter half of the year, analysts are closely monitoring the index for any signs of a definitive breakout. However, the most recent reading suggests that the "choppy" recovery observed since the beginning of 2026 is far from over, with the sector grappling with persistent overcapacity and muted pricing power.
The Mechanics of the WOW Index: A Multidimensional View
To understand the current state of the supply chain, it is essential to look at the methodology behind the WOW Supply Chain Activity Index. Unlike single-variable metrics that might track only freight volume or warehouse occupancy, the WOW Index is a composite indicator, aggregating nine distinct inputs to create a holistic view of the U.S. logistics landscape.
The index, maintained by the Fort Mitchell, Kentucky-based trailer rental firm Warehouse on Wheels, synthesizes data from:
- WOW Deployment Ratio: Measuring the real-time utilization of trailer assets.
- LMI Warehousing Utilization: Gauging the availability and usage of storage space.
- LMI Transportation Prices: Reflecting the pricing pressure within the freight market.
- Cass Freight Index: A key barometer for North American shipment volumes.
- ISM Manufacturing PMI: An indicator of the health of the industrial sector.
- ISM Supplier Deliveries: Measuring the speed of the supply chain.
- Mfrs. Inventories-to-Sales Ratio: Assessing the balance between stock and consumer demand.
- NY Fed Global Supply Chain Pressure Index: Accounting for international disruptions and logistical bottlenecks.
- U.S. Industrial Vacancy Rate: Tracking the saturation of commercial real estate.
The resulting index score—ranging from 0 to 100—serves as a high-fidelity pulse check for the industry. A score of 50 represents the long-run neutral baseline. Values below 45 are categorized as "Contraction," while values above 55 generally signal "Expansion."
Chronology of a Stalled Recovery
The narrative of the U.S. supply chain throughout 2026 has been one of fits and starts. After hitting a sobering cycle low of 33.4 in January 2026, the industry has spent the intervening months attempting to claw its way back toward equilibrium.
The First Quarter: Searching for a Bottom
January’s reading of 33.4 served as a wakeup call for the sector, highlighting an environment characterized by extreme overcapacity and aggressive price-cutting to secure limited freight. February offered a modest improvement, with the index rising to 39.5, suggesting that while the worst of the volatility might have passed, the path to recovery would be gradual.
The Second Quarter: The Plateau
March saw the index reach 43.1—the highest point in the current cycle—raising hopes that the industry was on the cusp of crossing into neutral territory. However, April brought a sobering reversal, as the index pulled back to 39.0. This volatility underscores the fragility of the current recovery.
In May and June, the index stabilized at 42.1 and 42.2, respectively. While these numbers remain in the contraction zone, the consistency of the last two months suggests that the market may have finally established a floor. The critical question for the industry now is whether this plateau is a foundation for growth or a long-term trap.
Supporting Data and Industry Implications
The implications of a 42.2 reading are felt across the entire logistics value chain. When the index sits in the contraction zone, the market dynamics shift in favor of shippers rather than carriers and warehouse operators.
Freight Rates and Pricing Power
With the index suppressed, trucking firms and logistics providers are finding it difficult to exercise pricing power. Ample warehouse capacity means that businesses are not under pressure to pay premiums for storage, and carriers are finding that freight rates remain suppressed due to a surplus of available equipment relative to demand.
The Warehouse Conundrum
The U.S. Industrial Vacancy Rate remains a critical component of the current malaise. During the pandemic-era boom, speculative warehouse construction surged to meet record demand. Now, with the supply chain cooling and consumer demand normalizing, that excess capacity is acting as a drag on the index. Until inventories-to-sales ratios align more closely with historical norms, warehousing utilization is unlikely to trigger a breakout in the index.
Manufacturing and Global Pressures
The inclusion of the ISM Manufacturing PMI and the NY Fed Global Supply Chain Pressure Index provides necessary context. If domestic manufacturing output remains stagnant, the demand for intermediate and finished goods transportation remains low. Furthermore, global supply chain pressures—while lower than their pandemic peaks—continue to affect import volumes at major U.S. ports, influencing the overall demand for domestic warehousing and trailer rentals.
Official Responses and Expert Outlook
Industry experts view the current plateau as a "wait-and-see" phase. While no official representative from Warehouse on Wheels has declared the contraction terminal, the underlying data points suggest that the market is waiting for a catalyst.
"We are seeing a market that is remarkably resilient but clearly exhausted," noted one logistics analyst familiar with the report. "The sector is not falling off a cliff, but it is not finding the momentum required to drive growth. The July reading will be the next major test; if we see a sustained move toward 45 or higher, we might finally be looking at a turning point."
The consensus among market observers is that the sector is awaiting a shift in broader macroeconomic conditions. Specifically, stabilization in interest rates and a potential uptick in consumer spending are frequently cited as the necessary "fuel" to push the index out of the contraction zone.
Implications for the Future: What to Watch
As the industry looks toward the late summer and fall, three key factors will determine whether the WOW Index can break out of its current stagnation:
- Inventory De-stocking Completion: Many retailers are still working through excess stock. Once inventory-to-sales ratios reach a leaner, more optimal level, restocking cycles could trigger a sharp increase in freight volumes.
- Seasonal Shifts: The approach of the holiday shipping season typically injects volume into the supply chain. If the August and September readings show a deviation from the current flatline, it may indicate a robust peak season.
- Capital Investment: The high-interest-rate environment has cooled speculative capital investment in logistics infrastructure. A return to growth in the index would likely require a renewed appetite for fleet modernization and warehouse automation.
The July and August Thresholds
The July index reading will be critical in determining whether the "low 40s" plateau is a temporary stop or a long-term ceiling. If the index remains stuck at 42, it will reinforce the theory that the supply chain has entered a "new normal" of low-growth operations. Conversely, a breakthrough toward the 45-point threshold would signal that the contractionary phase is nearing its end.
Ultimately, the U.S. supply chain remains in a state of recalibration. The WOW Index provides a clear, data-driven window into this process, reminding industry stakeholders that while the worst of the cycle lows appear to be behind us, the road to a fully restored, high-growth logistics environment is still under construction.
For now, the sector remains in a period of disciplined operations. Companies that can maintain efficiency in the face of limited pricing power are those most likely to navigate the current contraction safely. As the August release approaches, all eyes will be on whether the market has the strength to finally push through the resistance that has defined the summer of 2026.
About the Author