Executive Summary: A Sector in Limbo
The American supply chain remains mired in a period of extended sluggishness, failing to find the momentum required to return to long-run neutral growth. According to the latest data from the Warehouse on Wheels (WOW) Supply Chain Activity Index, the logistics and warehousing sector continues to operate well below historical benchmarks. For industry stakeholders—from freight carriers to warehouse operators—the data paints a sobering picture: despite a slow climb from the historic lows observed early in 2026, the sector has effectively plateaued, trapped in a "contraction zone" that suppresses pricing power and limits operational expansion.
As the industry looks toward the second half of the year, the primary question remains whether this plateau represents a floor from which a recovery will launch, or a prolonged stagnation that could force structural changes across the logistics landscape.
The Anatomy of the Index: Understanding the WOW Methodology
To understand the current state of the U.S. supply chain, one must look closely at how the WOW Supply Chain Activity Index derives its insights. Unlike singular metrics that measure only freight volume or warehousing demand, the WOW Index functions as a composite "thermometer" for the entire logistics ecosystem.
The index is constructed from nine distinct inputs, providing a multidimensional view of the health of the U.S. economy:
- WOW Deployment Ratio: Measures the utilization of trailer assets.
- LMI Warehousing Utilization: Tracks capacity usage within the warehouse sector.
- LMI Transportation Prices: Offers a gauge of freight rate health.
- Cass Freight Index: Measures North American freight shipment volumes.
- ISM Manufacturing PMI: Provides insights into industrial production sentiment.
- ISM Supplier Deliveries: Reflects the speed and reliability of the supply chain.
- Manufacturers’ Inventories-to-Sales Ratio: Indicates the balance of supply and demand.
- NY Fed Global Supply Chain Pressure Index: Accounts for international logistics disruptions.
- U.S. Industrial Vacancy Rate: Measures the physical availability of storage space.
The resulting index score operates on a scale of 0 to 100, where 50 represents the long-run neutral baseline. A reading below 45 signifies a "Contraction Zone," characterized by depressed pricing power, excess capacity, and a general lack of urgency in the freight markets.
Chronology: The Road to the 2026 Plateau
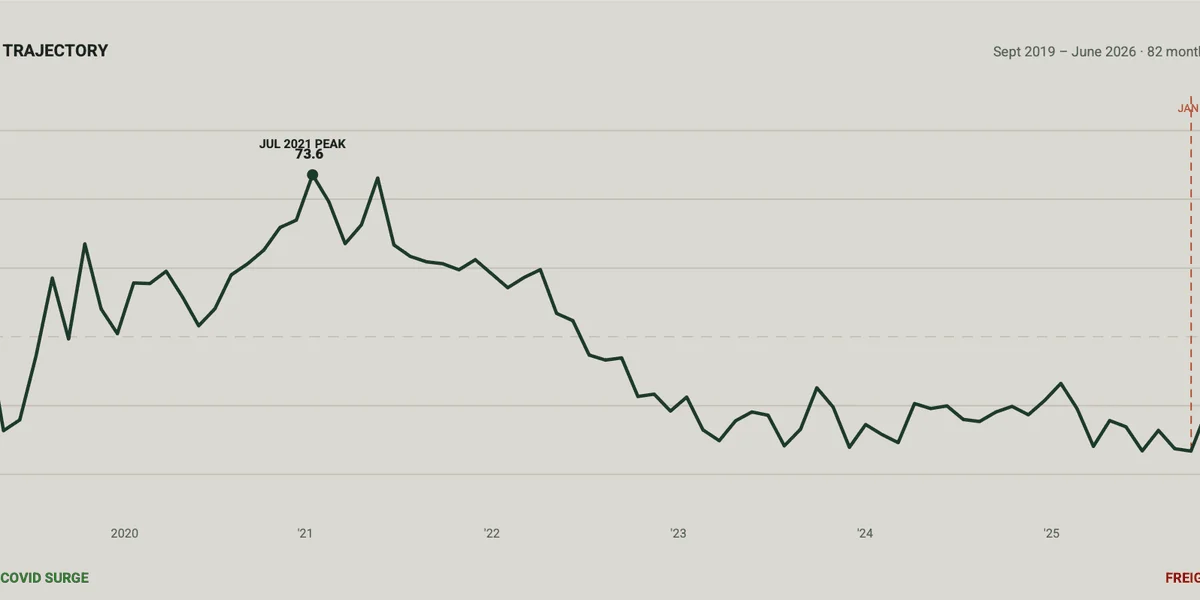
The path to the current 42.2 reading in June has been anything but linear. The logistics sector has experienced a "choppy" recovery following a brutal winter at the start of 2026.
The January 2026 Trough
In January 2026, the industry hit a cyclical nadir, with the index plunging to 33.4. This period represented the peak of market pessimism, marked by a massive oversupply of warehouse space, plummeting freight rates, and a significant pullback in manufacturing output.
The Spring Churn
As the calendar turned, analysts hoped for a swift V-shaped recovery. However, the data revealed a much more frustrating reality:
- February: A slight uptick to 39.5 offered a glimmer of hope.
- March: The index pushed higher to 43.1, nearing the boundary of the neutral zone.
- April: A disappointing pullback to 39.0 demonstrated the fragility of the recovery.
- May: A rebound to 42.1 suggested that the March peak was not an anomaly, but rather a sign that the market was stabilizing at a lower equilibrium.
- June: The current reading of 42.2 confirms that the sector is holding steady in the low 40s.
This sequence suggests that the market is currently caught in a "holding pattern." It is neither collapsing as it did in early 2026, nor is it gathering the necessary velocity to push toward the 50-point neutral threshold.
Supporting Data: Dissecting the Contractionary Environment
The current reading of 42.2 is not merely a number; it reflects a specific set of operational realities that logistics managers are facing daily.
Warehouse Capacity and Pricing Power
In a contractionary environment, the "pricing power" typically shifts heavily toward the shipper. Because there is an abundance of available warehouse capacity, 3PL (third-party logistics) providers and warehouse owners are finding it difficult to raise storage fees. The result is a margin-compression cycle where fixed costs remain high—due to labor and utility inflation—while revenue growth is stunted by soft demand.
The Freight Market Malaise
Transportation prices remain soft. While fuel costs have fluctuated, the core demand for truckload services has not seen the sustained growth required to tighten capacity. As long as the index remains below 45, carriers will continue to struggle with "deadhead" miles and lower spot market rates, limiting their ability to reinvest in fleet modernization or technology.
Global vs. Domestic Pressure
The NY Fed’s contribution to the index highlights an interesting divergence. While domestic manufacturing remains muted (as seen in the ISM PMI figures), global supply chain pressures have eased compared to the chaotic post-pandemic years. However, this lack of "pressure" is now translating into a lack of urgency, as supply chains have become more resilient but less active.
Official Perspectives: Industry Experts Weigh In
While Warehouse on Wheels (WOW) provides the quantitative framework, the qualitative sentiment from industry leaders matches the index’s caution.
"We are seeing a market that is waiting for a catalyst," says one industry analyst who tracks the WOW data. "The consumer is still spending, but the shift from goods to services, combined with high interest rates, has taken the wind out of the sails of inventory replenishment cycles. Warehouse operators are seeing volume, but they aren’t seeing the turnover velocity that generates real profit."
Logistics executives have noted that the "choppiness" identified by the index is reflected in their quarterly forecasting. Many firms have shifted their strategy from aggressive expansion to "operational optimization," focusing on labor efficiency and warehouse automation rather than acquiring new square footage.
Strategic Implications for the Supply Chain
What does this mean for businesses operating in the U.S. supply chain? The implications are three-fold:
1. The Strategy of "Lean Persistence"
Companies that assumed a post-2026 recovery would be rapid have had to adjust their strategies. The current environment favors those who have focused on debt reduction and asset efficiency. With the index failing to break 45, aggressive expansion plans are being shelved in favor of maintaining cash reserves.
2. The Battle for Talent
While the demand for logistics services is stagnant, the battle for skilled labor—such as warehouse management and fleet maintenance—remains competitive. Companies are caught in a paradox: they need to keep costs low because of the contraction, but they must pay more to retain the talent required to operate efficiently in a complex environment.
3. The "Wait and See" Approach to Capital Investment
The plateau at 42.2 acts as a deterrent for capital expenditure. Whether it is purchasing new electric vehicle (EV) fleets or investing in new automated storage and retrieval systems (AS/RS), the current index reading suggests that the "ROI horizon" is currently too uncertain for many CFOs. Until the index pushes toward 50, many firms will likely continue to sweat their existing assets.
Looking Ahead: The July and August Tests
As we move into the second half of the year, all eyes are on the upcoming releases. The July reading will serve as a critical litmus test for the current plateau. If the index stays at 42.2 or dips further, it will confirm that the sector is locked into a long-term period of stagnation.
However, if the August release shows a move toward 45 or higher, it could signal that the "choppy" recovery is finally finding a footing. Several macroeconomic factors could influence this:
- Interest Rate Policy: Any pivot in central bank policy could lower the cost of capital, potentially stimulating inventory replenishment.
- Retail Seasonality: The lead-up to the holiday shipping season often provides a boost to the logistics sector. If that surge fails to materialize in the August/September data, the industry may be facing a very difficult winter.
Conclusion: A New Normal?
The U.S. supply chain is currently in a state of purgatory. The 2026 data shows that while the sector is resilient enough to avoid a total collapse, it lacks the underlying economic vigor to thrive. The WOW Supply Chain Activity Index has become the essential barometer for this reality.
For now, the mantra for logistics professionals remains clear: operate with caution, prioritize efficiency over scale, and keep a close eye on the index. The road to the 50-point neutral threshold is long, and the current plateau suggests that the market is nowhere near the end of this journey. The logistics sector is not broken, but it is certainly tired—and it is waiting for a clear signal from the broader economy that it is time to move forward again.
About the Author