
In an era defined by rapid shifts in communication technology and evolving civic norms, understanding how Americans participate in public life has become a critical endeavor. To capture this complex landscape, Pew Research Center commissioned two major data collection initiatives in 2025: the Cross-Sectional Engagement Survey and Wave 179 of the American Trends Panel (ATP). These studies, conducted in partnership with SSRS, provide an unprecedented look at how engagement in politics, news consumption, and community activity shapes the American experience.
This report outlines the rigorous methodological frameworks, data collection protocols, and analytical techniques employed to ensure these findings reflect the diversity and nuance of the U.S. adult population.
1. The Cross-Sectional Engagement Survey: A Multimode Approach
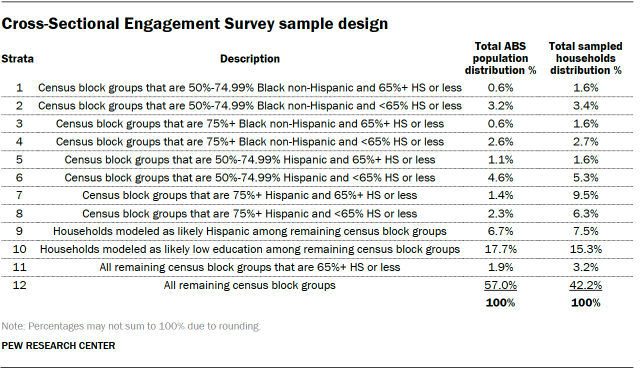
The 2025 Cross-Sectional Engagement Survey was designed to capture a broad, representative snapshot of the American public. Conducted between July 9 and December 5, 2025, the study utilized an address-based sampling (ABS) frame to ensure that residents across all 50 states and the District of Columbia had a non-zero chance of participation.

Methodology and Data Collection
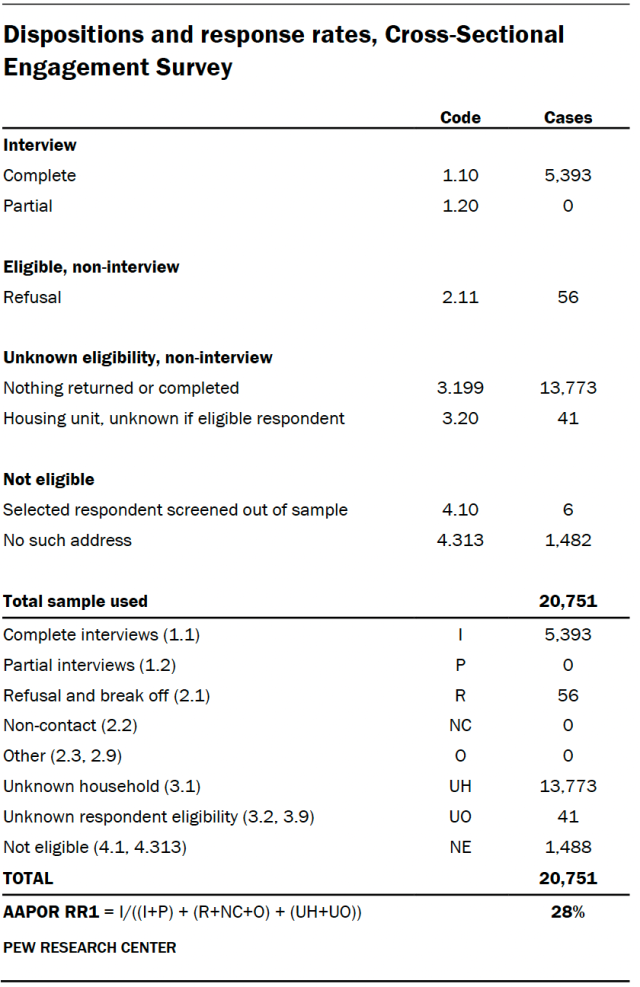
SSRS employed a robust, multimode protocol to maximize response rates. The process began with mailed invitations directed to 20,751 sampled addresses. To encourage participation, researchers utilized two randomized experiments: one testing the efficacy of QR codes for digital access, and another examining the impact of varying cash incentives ($1 vs. $2).
The field period was executed in two phases—a "soft launch" to test operational integrity, followed by a full-scale deployment. Participants were offered three distinct ways to engage:
- Online: Accessible via a provided URL and unique password.
- Paper: A physical booklet mailed to non-responders in the later stages of the field period.
- Telephone: A toll-free number allowed participants to complete the survey with a live interviewer.
The final dataset comprised 5,393 respondents: 2,705 online, 2,500 via paper, and 188 via phone. The AAPOR Response Rate 1 for this study was 28%. To ensure linguistic inclusivity, materials for households in high-probability Hispanic strata were provided in both English and Spanish.
Weighting and Statistical Precision
To translate the sample into reliable population-level inferences, SSRS applied a multistep weighting process. This included:
- Base Weighting: Accounting for differential probabilities of selection from the U.S. Postal Service Computerized Delivery Sequence File and household size.
- Adaptive Mode Adjustment: Correcting for potential biases introduced by the transition between digital and paper response modes.
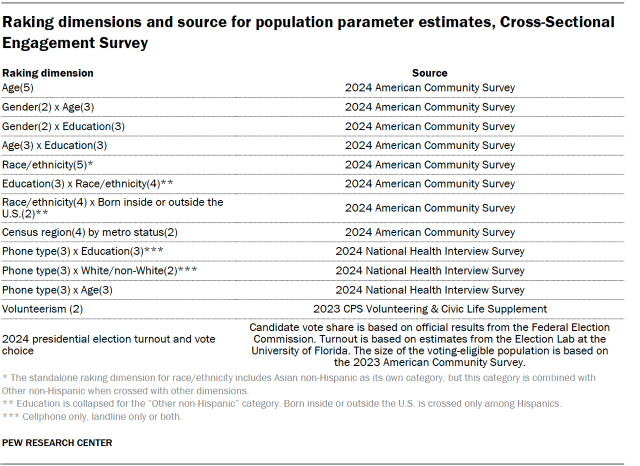
- Raking Calibration: Iterative proportional fitting was used to align the sample with known benchmarks for the noninstitutionalized U.S. adult population (ages 18 and older).
The final design effect (deff) and margin of error were calculated to account for these weighting adjustments. For full-sample estimates at a 50% distribution, the margin of error is ±1.9 percentage points at the 95% confidence level.
2. The American Trends Panel (ATP) Wave 179
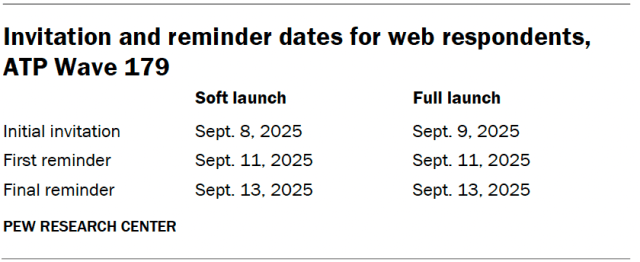
While the cross-sectional survey provided a wide-angle view, the American Trends Panel (ATP) Wave 179 offered a longitudinal, deep-dive analysis. Conducted from September 8 to September 14, 2025, this survey engaged 5,195 panelists—a high-response cohort representing a long-standing, nationally representative group.
Recruitment and Panel Integrity
The ATP utilizes a sophisticated recruitment strategy that has evolved since its inception in 2014. Since 2018, the panel has relied on address-based sampling, which covers an estimated 90% to 98% of the U.S. population.
To maintain data quality, researchers employed:
- Oversampling: Specifically targeting non-Hispanic Asian adults to ensure statistically significant insights into this demographic.
- Data Quality Checks: Rigorous screening for "satisficing"—a pattern where respondents provide minimal or automated answers. Four respondents were excluded from the final analysis due to these quality control triggers.
- Differential Incentives: To combat attrition and ensure participation among "hard-to-reach" populations, incentives ranged from $5 to $15, offered as gift codes or checks.
The survey-level response rate for Wave 179 was an impressive 89%, with a cumulative response rate (accounting for historical attrition) of 3%.

3. Engagement Group Creation: A Data-Driven Typology
One of the most significant contributions of the 2025 research is the classification of Americans into distinct "engagement groups." Rather than relying on broad categories, researchers utilized cluster analysis to identify patterns across 19 specific behaviors, including volunteerism, news consumption, social media interaction, and political donation.
The Clustering Technique
The team utilized a k-medoids algorithm via the WeightedCluster package in R. This approach is particularly effective at handling mixed data types. By analyzing behaviors such as attending local government meetings, discussing current events, and participating in political marches, the model generated groups that were both statistically cohesive and substantively distinct.
The 19 input variables were treated with equal weight, and because the analysis relied on Gower’s distance, the researchers avoided the potential bias of standardizing variables that were measured on different scales (e.g., binary "yes/no" vs. frequency-based scales).
Projecting to the ATP
To bridge the gap between the behavioral data of the cross-sectional survey and the attitudinal data of the ATP, researchers projected the engagement groups onto the ATP Wave 179 sample. By measuring the similarity of behavioral patterns between the two datasets, the team successfully linked the "how" of public engagement to the "why"—allowing for an analysis of how different types of engaged citizens view trust in news, political systems, and the future of the country.
4. Methodological Implications and Reliability
The dual-survey approach implemented in 2025 represents a gold standard in modern survey research. By combining the broad reach of a cross-sectional study with the longitudinal depth of a panel survey, Pew Research Center has minimized the risks of reliance on a single data source.
Managing Error
Researchers acknowledged that while random sampling error is quantified through margins of error (±1.9% for the cross-sectional survey and ±1.6% for the ATP), other sources of error remain. These include:
- Question Wording: The potential for subtle framing effects to influence respondent sentiment.
- Reporting Inaccuracy: The tendency for respondents to misremember or exaggerate their own civic participation.
- Nonresponse Bias: Despite sophisticated weighting, the 28% response rate in the cross-sectional survey highlights the ongoing challenge of engaging the full spectrum of the public.
Statistical Robustness
The clustering analysis was subjected to sensitivity testing. By running the k-medoids model multiple times with different random starts, the team confirmed that the results were robust. The selected typology was not merely the result of a single algorithmic run but a consensus model that performed well statistically and provided clear, meaningful insights for policy observers and the public alike.
5. Conclusion: A New Standard for Civic Insight
The 2025 engagement project demonstrates that the future of public opinion research lies in the integration of high-quality, address-based sampling and advanced statistical modeling. By creating an engagement typology rooted in actual behavior rather than self-identification, the researchers have provided a framework that will likely inform political science, sociology, and public policy for years to come.
As the American public continues to navigate a fragmented information environment and changing civic landscape, these datasets serve as a vital map. They move beyond the surface-level noise of political polling to reveal the structural foundations of how, why, and to what extent citizens participate in the life of their nation. For those seeking to understand the health of American democracy, the rigor of this 2025 methodology serves as the bedrock upon which all future analysis must be built.
About the Author