

In an era defined by rapid demographic shifts and evolving economic landscapes, understanding how Americans define the “American Dream” requires more than simple polling—it demands rigorous scientific inquiry. Pew Research Center’s Wave 181 of the American Trends Panel (ATP), conducted in October 2025, represents a sophisticated fusion of traditional survey methodology and cutting-edge artificial intelligence. By surveying over 8,000 U.S. adults, researchers sought to move beyond surface-level sentiment to uncover the nuanced, diverse, and often contradictory ways citizens envision success and stability in the 21st century.
Main Facts: A Representative Snapshot of the Nation
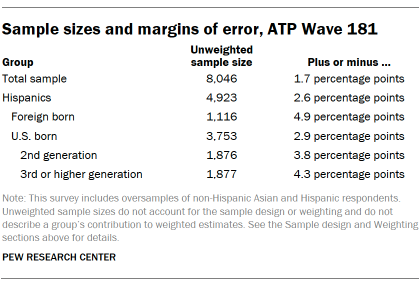
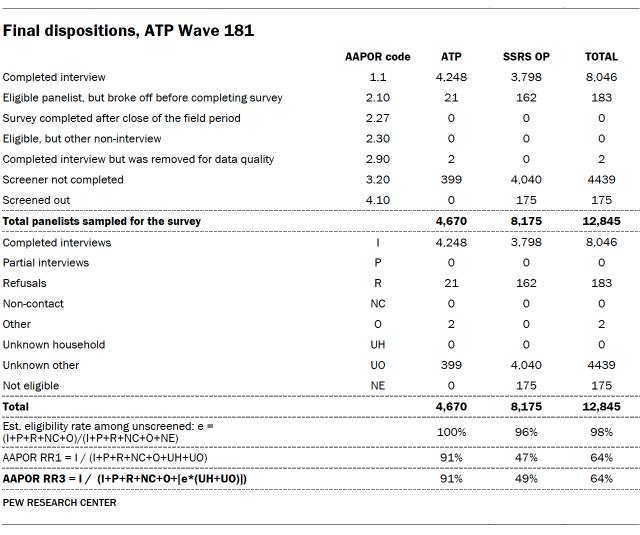
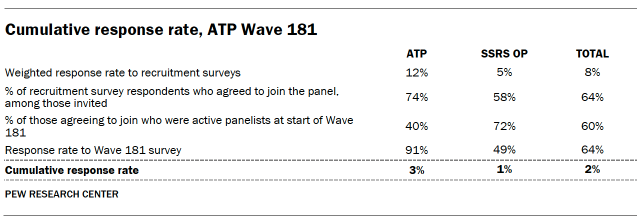
The survey, which ran from October 6 to October 16, 2025, achieved a robust sample size of 8,046 respondents. This group was drawn from the ATP, a nationally representative panel, supplemented by the SSRS Opinion Panel. With a survey-level response rate of 64% (AAPOR RR3), the data offers a high degree of statistical reliability, maintaining a margin of error of plus or minus 1.7 percentage points for the full sample.

To ensure the voices of historically underrepresented groups were heard, the study employed intentional oversampling of non-Hispanic Asian and Hispanic adults. These cohorts were later weighted back to their true proportions within the U.S. population to ensure the final analysis remained reflective of the broader national demographic landscape. The survey was conducted primarily online (7,784 respondents), with a smaller cohort (262 respondents) interviewed via live telephone, ensuring accessibility across different age groups and technical literacy levels.
Chronology: The Lifecycle of a Major Research Study
The journey of Wave 181 was a carefully orchestrated process spanning several months of preparation and a tightly controlled ten-day field period.
- Pre-Survey Phase: Prior to the October launch, researchers engaged in extensive questionnaire development and testing. The web interface underwent rigorous stress testing on both PC and mobile platforms, while data logic was validated through simulated responses in SPSS to prevent technical glitches.
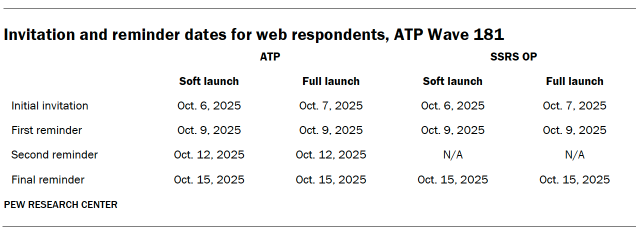
- October 3–6: The “prenotification” phase began with postcards sent to potential telephone respondents.
- October 6: The “Soft Launch” commenced. This critical pilot phase involved 801 panelists (60 from the ATP and 741 from the Opinion Panel) to monitor for potential issues in questionnaire flow or technical comprehension.
- October 7: Following the successful soft launch, the full-scale survey was deployed. Invitations were sent to the remaining English- and Spanish-speaking participants.
- October 7–16: The data collection window remained open. During this time, participants received multiple reminders via email and, for those who consented, SMS. Phone participants were subject to up to six call attempts by trained SSRS interviewers to maximize participation rates.
- Post-Survey Analysis: Once the data was collected, quality control checks were performed. Two respondents were removed from the dataset due to "satisficing"—a pattern of behavior where participants rush through surveys or select the same answer for every question regardless of content.
Supporting Data: Ensuring Equity and Accuracy
A centerpiece of this methodology is the sophisticated approach to economic data. Recognizing that a dollar in San Francisco carries a vastly different weight than a dollar in Pine Bluff, Arkansas, the research team adjusted all family income data based on regional cost-of-living differences and household size.
For example, a family in the low-cost Pine Bluff area with an income of $40,200 is treated as having equivalent financial stability to a family in San Francisco earning $59,100. This adjustment allows researchers to categorize respondents into income tiers that accurately reflect their standard of living rather than relying on raw, misleading dollar figures.
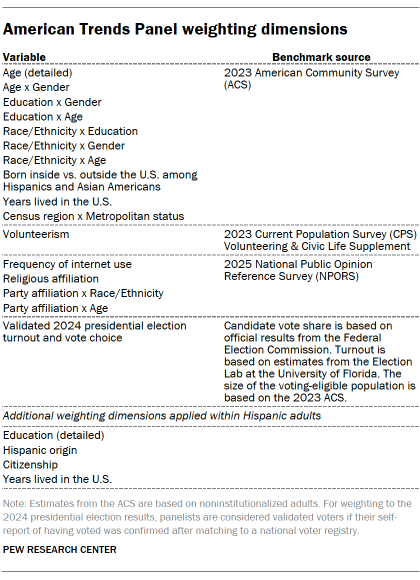
Furthermore, the weighting process was multi-staged. It began with base weights reflecting the probability of recruitment into the panel and was subsequently calibrated against national benchmarks. To prevent a small number of high-weight respondents from skewing the results, weights were trimmed at the 1st and 99.5th percentiles. This meticulous balancing act ensures that the resulting analysis is not just a collection of opinions, but a mathematically sound representation of the American adult population.
Official Methodology: The Integration of AI
Perhaps the most innovative aspect of this report is the use of Large Language Models (LLMs)—specifically GPT-5.2—to analyze open-ended responses to the question: "In a few words, what does the American dream mean to you?"
Traditional manual coding of thousands of open-ended responses is labor-intensive and prone to human fatigue. To modernize this, Pew researchers implemented a "model-assisted codebook development process."
- Human-AI Collaboration: Researchers first identified themes through a pilot study of responses.
- Unsupervised Machine Learning: Using the "HypotheSAES" method, the team generated candidate themes from the data itself.
- LLM Implementation: The final codebook was fed into GPT-5.2, which was prompted to classify each of the 7,247 responses into one or more of 15 discrete categories.
- Validation: To ensure the AI remained accurate, the model was tested against a "gold standard" set of 201 responses manually coded by humans. The automated coding achieved an impressive micro-averaged F1 score of 0.89, indicating a high degree of agreement between machine categorization and human judgment.
This hybrid approach allows for the analysis of thousands of unique, qualitative insights while maintaining the rigor of quantitative research.
Implications: Why This Matters
The methodology behind Wave 181 serves as a blueprint for modern social science. In an era where digital communication is fragmented and public discourse is often polarized, the ability to collect high-quality, representative data is a cornerstone of democracy.
The decision to oversample Asian and Hispanic populations reflects a recognition that the "American Dream" is no longer a monolithic concept. It is experienced differently by immigrant communities, multi-generational families, and individuals across vastly different economic strata. By standardizing income based on geography and employing AI to interpret the subjective hopes of thousands of citizens, Pew Research Center provides a more granular, accurate map of the national psyche.
The implications for policymakers and the public are clear: when we understand how different segments of the population define success—whether it is homeownership, career stability, or simply providing for their children—we can move away from ideological assumptions and toward evidence-based discussions. The rigor applied to this survey ensures that when the final results are presented, they reflect the authentic, nuanced reality of life in the United States today.
As technology continues to reshape how we conduct research, the marriage of human oversight and machine learning demonstrated here suggests that the future of polling is not just about counting heads, but about deeply understanding the complexities that define our collective experience. This methodological transparency does more than just validate the survey results; it builds trust in the data, ensuring that the findings remain a vital resource for scholars, journalists, and citizens alike.
About the Author